Comparison Of Prices Over 90 Years
Average Cost Of New Home
1930 $3,845.00
1940 $3,920.00
1950 $8,450.00
2023 $436,8001960 $12,700.00
1970 $23,450.00
1980 $68,700.00
1990 $123,000.00
2000 $119,600
2008 $238,880
2013 $289,500
2018 $385,880
2021 $408,800
Average Wages
1930 $1,970.00
1940 $1,725.00
1950 $3,210.00
2023 $69,480
1960 $5,315.00
1970 $9,400.00
1980 $19,500.00
1990 $28,960.00
2000 $41,673.83
2008 $40,523
2013 $44,321
2018 $52,145.80
2021 $51,480
Average Cost of New Car
1930 $600.00
1940 $850.00
1950 $1,510.00
2023 $49,500
1960 $2,600.00
1970 $3,450.00
1980 $7,200.00
1990 $16,950.00
2000 $21,850
2008 $27,958
2013 $31,352
2018 $35,742
2021 Forcast increase 5.4%
Average Cost Gallon Of Gas
1930 10 cents
1940 11 cents
1950 18 cents
2023 July $3.68
1960 25 cents
1970 36 cents
1980 $1.19
1990 $1.34
2000 $1.26
2009 $2.051
2013 $3.80
2018 $2.82
2021 Current ( April ) $2.87
Our Price Basket from 2008 to 2023
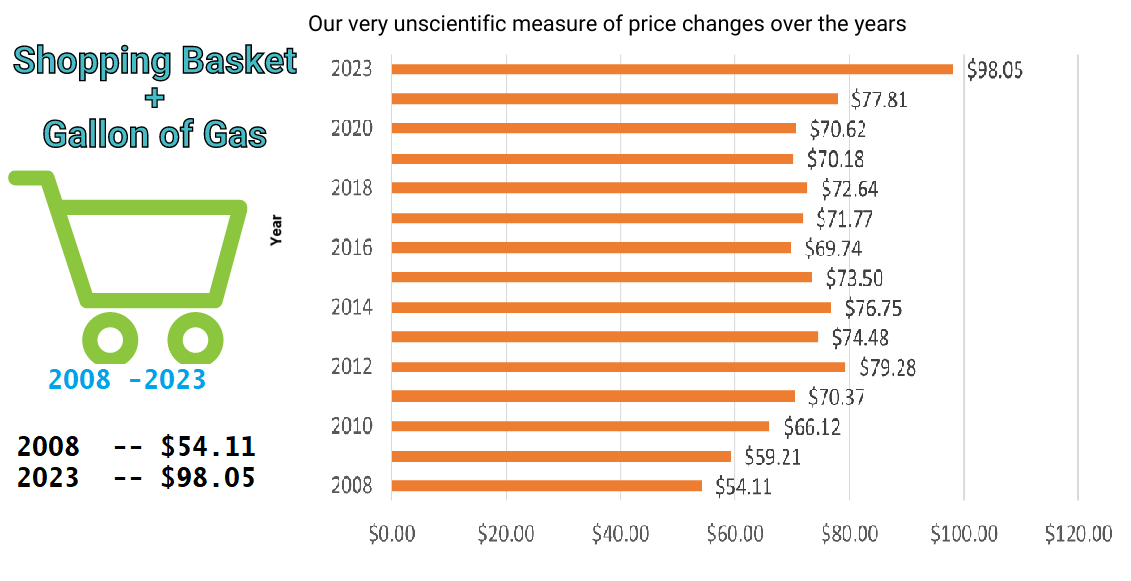 Updated Price Basket 2023
This shows the highest increase since we began collecting the data in 2008
26% increase from 2021 to 2023
Our Basket includes 20 of the basics needed to live Bread, Milk, Meat, Sugar ETC.
Average Cost Loaf of Bread
1930 9 cents
1940 10 cents
1950 12 cents
2023 $2.50
1960 22 cents
1970 25 cents
1980 50 cents
1990 70 cents
2000 $1.26
2008 $2.79
2013 $3.80
2018 $1.98
2021 $2.12
Average Cost 1lb Hamburger Meat
1930 12 cents
1940 20 cents
1950 30 cents
2023 $7.92
1960 45 cents
1970 70 cents
1980 99 cents
1990 89 cents
2000 $2.46
2008 $3.99
2013 $4.68
2018 $4.32
2021 $4.03
Some of the above can be explained due to the inflation over 80 years , but there are also many other reasons why some prices increased dramatically ( Housing Bubbles. Middle East Wars, Weather problems causing food price inflation, Population explosion, ) it also can work the other way due to improvements in technology offering much cheaper goods for example TV's, Calculators, Computers ETC.