Our Price Basket
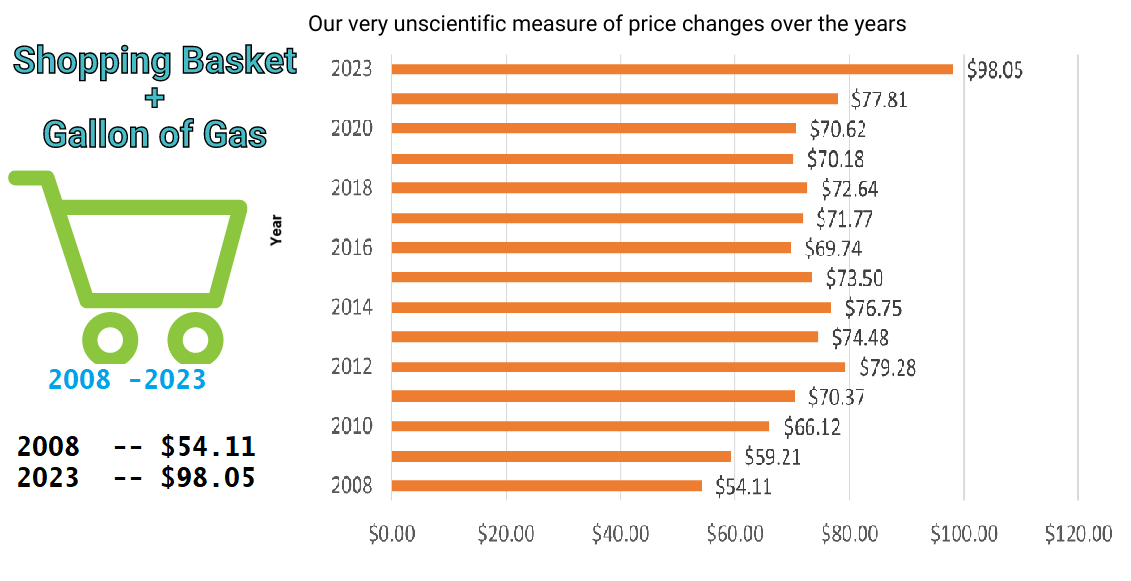
Our basket is representative of the goods and services we all use and buy, obviously different people spend different amounts and buy different types from what we use to calculate the basket, but overall, we believe the products provide an example of a typical cart that allows us to measure on a yearly basis. You can find below a more detailed list of what we included and the dates and locations prices gathered from
Our Price Basket - or Cost Of Living ( Inflation ) 2008 - 2023
Price Basket Consist of the following July 2023 Prices
Bread (Sara Lee White Bread) - $ 2.50 - Potatoes (Russet) - 79¢ cents per LB - Milk Prairie Farms - $2.58 - Bacon (Hormel 16 oz) - $4.98 - Dozen Eggs (Walmart Brand Regular) - $1.92 - Coke (24 pack can) - $12.78 - Water (12 pk Ice Mountain) - $3.64 - Tomatoes (LB Roma) - $1.44 - Butter (15 oz Can't Believe It's Not Butter) - $3.98 - Cornflakes (18 oz) - $4.98 - Pizza (Jacks Pepperoni) - $3.86 - Sugar (4 LB) - $3.12 - Flour (5 LB) - $2.34 - Ground Beef (LB Lean) - $7.92 - Tide Powder (5.93 LB) - $15.34 - Folgers Classic Roast (Sizes - 1 LB 14.5 OZ) - $12.96 - Green Grapes (LB) - $2.50 - Toilet Paper Rolls (Scott 4 pk) - $4.97 - Chicken Soup (Cream of Chicken Campbells 10.5 oz) - $1.26 - 1 Gallon of Gas $3.59Some notes on our Price Basket:
1. Our basket shows an increase of 26% from 2021 to 2023 which is by far the highest percentage increase we have seen
2. Some manufacturers change the weight of items which makes it more difficult to reflect real price changes. Most notable was the weights of Coffee and Laundry detergent. They are consistently variable. We have also noticed that the bag of Sugar has been reduced from the traditional 5 Lbs. to 4 Lbs.
3. We have taken food prices from our local Wal-Mart and try to update every few months when we have the time. This is not a super scientific method but we still believe it can show some of the basic effects of inflation on prices in the long term.
4. Fresh produce prices can rise and fall depending on the season, but we still include them with the hope that it will contribute to the information in the long term.
5. Prices from 2008 to 2012 were taken from a Wal-Mart located in a Rural/Small Town populated area in SE Wisconsin. Prices from 2013 to 2023 were taken from Walmart online prices
6. The prices in the graph include all of the food items plus one gallon of gas.
7. These figures are also dependent on special offers by the store or manufacturer or a combination of both.
Price of Sarah Lee Bread White Bread 2008 - 2023
2011 $1.98 2012 $1.88 2013 $1.98
2014 $1.98 2015 $1.98 2016 $1.98
2017 $1.98 2018 $1.98 2019 $2.19
2020 $2.08 2021 $2.54 2023 $2.50
Price of 1 LB Potatoes (Russet) 2008 - 2023

2011 60¢ 2012 42¢ 2013 88¢
2014 49¢ 2015 78¢ 2016 78¢
2017 78¢ 2018 88¢ 2019 88¢
2020 78¢ 2021 39¢ 2023 73¢
Price of Gallon of Milk Prairie Farms 2008 - 2023
2011 $3.39 2012 $2.79 2013 $4.28
2014 $3.15 2015 $3.98 2016 $3.98
2017 $3.12 2018 $3.22 2019 $3.42
2020 $4.12 2021 $4.77 2023 $2.58
Price of 1lb Bacon ( Hormel ) 2008 - 2023
2011 $3.98 2012 $4.48 2013 $4.28
2014 $4.98 2015 $5.48 2016 $5.24
2017 $4.48 2018 $4.48 2019 $5.18
2020 $4.98 2021 $6.48 2023 $4.98
Price of Dozen Eggs Store Brand Large 2008 - 2023

2011 $1.25 2012 $1.54 2013 $1.88
2014 $1.98 2015 $2.77 2016 $1.33
2017 $0.68 2018 $0.68 2019 $0.78
2020 $1.58 2021 $1.63 2023 $1.92
Average Price Gallon of Gas 2008 - 2023

2011 $3.89 2012 $3.91 2013 $3.80
2014 $2.75 2015 $2.21 2016 $2.49
2017 $2.43 2018 $2.93 2019 $2.26
2020 $2.38 2021 $3.28 2023 $3.59
Movie Ticket 2008 - 2023
2008 $6.95 2009 $7.18 2010 $7.50 2011 $8.20 2012 $8.20 2013 $10.25 2014 $10.25 2015 $10.65 2016 $10.49 2017 $8.86 2018 $9.16 2019 $9.11 2021 $13.69 2023 $13.50First Class Stamp 2008 - 2023
2008 42¢ 2009 42¢ 2010 44¢ 2011 44¢ 2012 45¢ 2013 46¢ 2014 49¢ 2015 49¢ 2016 47¢ 2017 49¢ 2018 50¢ 2019 55¢ 2021 55¢ 2023 66¢College Tuition 2008 - 2023
2008 $6,015 2009 $6,585 2010 $7,020 2011 $7,605 2012 $7,695 2013 $8,893 2014 $9,139 2015 $9,410 2016 $9,960 2017 $9,650 2018 $9,970 2019 $10,230 2021 $10,560 2023 $26,027Wrangler Jeans 2008 - 2019
2008 N/A 2009 N/A 2010 $15.98 2011 $17.68 2012 $15.77 2013 $15.77 2014 $16.77 2015 $16.77 2016 $16.77 2017 $16.77 2018 $16.77 2019 $16.86 2021 $18.36 2023 $18.98Average House Rent 2008 - 2023
2008 $800 2009 $780 2010 $945 2011 $955 2012 $1045 2013 $1195 2014 $1314 2015 $1,258 2016 $1,300 2017 $1,600 2018 $1,641 2019 $1,465 2021 $1,246 2023 $1,702Average House Purchase 2008 - 2023
2008 $238,880 2009 $232,880 2010 $268,700 2011 $202,100 2012 $263,200 2013 $289,500 2014 $373,500 2015 $364,100 2016 $379,800 2017 $371,200 2018 $318,500 2019 $236,500 2021 $408,800 2023 $436,800KW/Hr Electric 2008 - 2019
2008 11.03¢ 2009 11.76¢ 2010 11.97¢ 2011 12.35¢ 2012 13.30¢ 2013 13.30¢ 2014 12.72¢ 2015 12.00¢ 2016 12.00¢ 2017 13.22¢ 2018 12.00¢ 2019 10.33¢Wages 2008 - 2023
2008 $40,523 2009 $39,423 2010 $39,856 2011 $40,925 2012 $44,321 2013 $44,888 2014 $46.481 2015 $44,600 2016 $46,409 2017 $44,564 2018 $46,464 2019 $47,060 2021 $51,480 2023 $69,480Unemployment Percentage 2008 - 2023
2008 5.4% 2009 8.6% 2010 9.8% 2011 9.2% 2012 8.1% 2013 6.7% 2014 5.8% 2015 5.0% 2016 4.7% 2017 4.3% 2018 3.9% 2019 3.8% 2021 ( Nov ) 4.2% 2023 ( July ) 3.6%Fed Base Rate Percentage 2008 - 2023
2008 4.25% 2009 1.00% 2010 0.25% 2011 0.25% 2012 0.25% 2013 0.25% 2014 0.25% 2015 0.25% 2016 0.5% 2017 1.25% 2018 1.75% 2019 2.25% 2020 1.75% 2021 0.15% 2021 5.25%Dow Jones 2008 - 2023
2008 12,500 2009 9,171 2010 9,908 2011 11,326 2012 13,553 2013 15,883 2014 17,280 2015 17,245 2016 17,993 2017 21,987 2018 25,262 2019 25,450 2020 28,875 2021 Dec 34,580 2023 July 35,227Inflation US Gov 2008 - 2023
2008 3.8% 2009 0.4% 2010 1.1% 2011 3.1% 2012 2.6% 2013 1.5% 2014 1.7% 2015 1.3% 2016 1.6% 2017 1.7% 2018 1.9% 2019 2.1% 2021 6.2% 2023 2.97%CPI US Gov ## based upon a 1982 Base of 100 ## 2008 - 2019
2008 216.632 2009 213.856 2010 218.178 2011 224.906 2012 233.506 2013 233.049 2014 234.8 2015 236.51 2016 239.26 2017 244.786 2018 245.44 2019 245.13Gold per Ounce 2008 - 2023
2008 $820.00 2009 $953.00 2010 $1,068.33 2011 $1,559.95 2012 $1,677.95 2013 $1,208.00 2014 $1,221.80 2015 $1,085.70 2016 $1,272.50 2017 $1,326.65 2018 $1,297.70 2019 $1,294.65 2020 $1,556.65 2021 $1,612.28 2023 $1,966.21
We spent many hours researching cost of living information for each year and I created this page after being asked a number of times about why I did not include current prices alongside our cost of living information for each year and thought this was the easiest way to make the information available. includes Average Cost Of New Home, Average Wages, New Car cost, Gallon Of Gas and a 1lb Hamburger Meat, 1920 to 2023
Healthcare Costs
We have struggled to find reliable, unbiased figures on the cost of healthcare over the past few years so we do not include that in what we have provided but thought it was important to address the subject with a few observations. Over the past few years, healthcare costs for the average person have seemed to increase significantly, taking up a larger portion of a person's wages than before. What many figures and reports tell us, and what many working people already know, is that employers have been shifting the cost of healthcare to employees by reducing the number of fuller coverage options available for insurance and encouraging employees to use high-deductible plans which end up costing more out of pocket for the individual or family. These changes can significantly contribute to the reasons that wage stagnation has felt particularly hard on the American consumer's wallet in the past few years. There have also been prescription drug price increases as well as decreases with more generic options available, these can also effect the overall cost of healthcare.
College Tuition and Student Loans
The cost of college tuition in most public institutions has also increased dramatically over the past few years, with out-of-state prices increasing a little more than in-state, in general. This has contributed to the fact that more students are leaving college with larger student loans than before. Having large student loans can impact the amount of extra income that many new entrants into the working world have at their disposal as those loans have to be paid back and often have higher interest rates than the current Federal rate. This can make it more difficult for the younger generations to save money, buy homes, and contribute to the economy through spending on higher ticket items like cars and other investment options.
Price of 24 pack of Coke 2008 - 2023
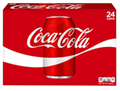
2011 $6.98 2012 $6.98 2013 $7.18
2014 $7.18 2015 $5.98 2016 $6.48
2017 $7.68 2018 $7.68 2019 $7.68
2020 $7.68 2021 $8.98 2023 $12.78
Price of 12 Pack Water 2008 - 2023
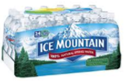
2011 $2.63 2012 $2.68 2013 $2.63
2014 $2.50 2015 $2.63 2016 $2.63
2017 $2.48 2018 $1.88 2019 $2.63
2020 $2.48 2021 $2.98 2023 $3.64
Price of Folgers Classic Roast (priced as 2 Lb 9 Ounces up to 2017) 2008 - 2023
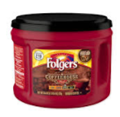
2011 $12.98 2012 $8.98 2013 $7.98
2014 $8.98 2015 $10.63 2016 $9.48
2017 $10.05 2018 $7.48 2019 $7.48
2020 $6.96 2021 $7.56 2023 $12.96 ** Price adjusted for change in size from 2LBS 9 Ounces to 1 Lb 14.5 Ounces **
Price of Lb Green Grapes 2008 - 2023

2011 $1.96 2012 $1.98 2013 $2.48
2014 $1.98 2015 $1.48 2016 $2.28
2017 $1.78 2018 $1.88 2019 $1.88
2020 $1.48 2021 $1.48 2023 $2.50
Price of Scott 4 pack Toilet Rolls 2008 - 2023
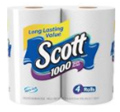
2011 $3.98 2012 $3.96 2013 $3.98
2014 $3.98 2015 $3.98 2016 $3.98
2017 $3.98 2018 $3.48 2019 $3.48
2020 $3.82 2021 $4.00 2023 $4.57
Price of Campbell's Cream Of Chicken Soup 2008 - 2023
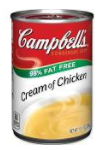
2011 $2.10 2012 $1.75 2013 $1.58
2014 $1.35 2015 $1.34 2016 $1.58
2017 $1.58 2018 $1.48 2019 $1.48
2020 $1.48 2021 94¢ 2023 $1.25
Price of 1 lb Roma Tomatoes 2008 - 2023
 2008 68¢
2009 75¢
2010 97¢
2008 68¢
2009 75¢
2010 97¢ 2011 $1.59 2012 $1.79 2013 $1.12
2014 $1.18 2015 $1.24 2016 98¢
2017 98¢ 2018 $1.48 2019 $1.28
2020 $0.88
2021 98¢ 2021 $1.44
Price of Can't Believe It's Not Butter 15 ounces 2008 - 2023
 2008 $1.90
2009 $1.94
2010 $2.28
2008 $1.90
2009 $1.94
2010 $2.28 2011 $2.68 2012 $2.68 2013 $2.49
2014 $2.88 2015 $2.88 2016 $2.88
2017 $2.68 2018 $2.98 2019 $2.98
2020 $2.98 2021 $2.98 2023 $3.98
Price of Cornflakes - Large -- 18 Ounces 2008 - 2023
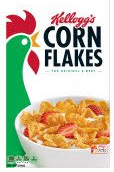 2008 $2.34
2009 $2.68
2010 $2.98
2008 $2.34
2009 $2.68
2010 $2.98 2011 $3.50 2012 $1.98 2013 $2.92
2014 $2.98 2015 $2.93 2016 $2.93
2017 $2.98 2018 $2.98 2019 $3.28
2020 $3.28 2021 $3.28 2023 $4.98
Price of Pizza -- Jacks Pepperoni 2008 - 2023

2011 $3.00 2012 $3.33 2013 $2.52
2014 $2.98 2015 $2.50 2016 $2.36
2017 $2.98 2018 $2.98 2019 $2.98
2020 $2.50 2021 $2.98 2023 $4.98
Price of 4 Lb Bag of Sugar 2008 - 2023
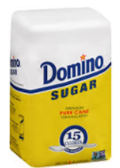
2011 $2.92 2012 $2.42 2013 $2.68
2014 $1.98 2015 $2.47 2016 $2.17
2017 $2.00 2018 $1.43 2019 $1.37
2020 $1.74 2021 $2.08 2023 $2.34
Price of 5 Lb Bag of Flour 2008 - 2023
2011 $3.12 2012 $2.98 2013 $2.46
2014 $1.98 2015 $1.46 2016 $1.38
2017 $1.23 2018 $1.22 2019 $1.22
2020 $1.22 2021 $1.56 2023 $2.34
Price of Lb Ground Beef 2008 - 2023

2011 $3.78 2012 $4.78 2013 $4.68
2014 $5.98 2015 $5.26 2016 $4.97
2017 $4.96 2018 $4.96 2019 $4.77
2020 $5.24 2021 $5.96 2023 $7.92
Price of Tide Detergent 2008 - 2023
2011 $10.55 2012 . $17.97 2013 $11.98
2014 $17.97 2015 $11.76 2016 $12.57
2017 $12.96 2018 $12.96 2019 $12.96
2020 $12.96 2021 $12.96 2023 $15.94